

Current data in official reports issued by the Federal Reserve and the U.S Census Bureau, confirms that as of Quarter 1 2020, the average American household is now in debt to the tune of $5700.
There are several key factors that affect the average credit card and overall household debt figures, including age, income, gender, race, and geographical location (which state you happen to live in).
Let’s take a quick look at how each of these important factors can affect the average amount of credit card and household debt.
How much are you likely to owe based on your age?
The chart below is taken from the Quarterly Report on Household Debt and Credit which was issued by the Federal Reserve in May 2020.
It is the most up to date information currently available on U.S. Household and credit card debt:

As you can see, the total amount of debt has been rising consistently across all age groups since 2014 and has in fact approximately doubled from around 7 trillion in 2003 to the current household debt figure of 14.30 trillion.
As the chart shows, the 40 to 49 age bracket typically has the most household debt, and those who owe the least are at opposite ends of the spectrum (18 to 29-year-olds and the over 70’s).
The Survey of Consumer Finances is issued every three years, and the 2019 survey is still being processed, so according to the most recent data (taken from the 2016 report) the total average amount of debt owed by each age bracket is as follows:
- Under 35: $67,400
- 35–44: $133,100
- 45–54: $134,600
- 55–64: $108,300
- 65–74: $66,000
- 75 and up: $34,500
According to this data, it is those in the 45 to 54 age group owe the most, and those over 75 who owe the least.
According to a Northwestern Mutual survey conducted in 2018, among millennials, credit card debt makes up approximately 20% of the total debt owed.
While student loans comprise 21% of outstanding debt.
How much are you likely to owe based on your income and race?
When you look at how household incomes relate to outstanding debt, the official figures seem to confirm that the more you earn the more you are likely to borrow.
These are the average debt amounts for the main 6 income brackets according to Debt.org
- $160,000 and more – $11,200
- $115,000 to $159,999 – $8,300
- $70,000 to $114,999 – $5,800
- $45,000 to $69,999 – $4,900
- $25,000 to $44,999 – $3,900
- Less than $24,999 – $3,000
The Federal Reserves report on the Economic Well being of U.S households in 2019 (featuring data from the first quarter of 2020) shows that both income and race play a huge role in our credit-related behavior.
For example, Table 13 below clearly shows that as our income increases, so does our confidence in being successful in applying for credit:

We can also see that even at the highest income brackets, black and Hispanic applicants do not typically have as much confidence in their ability to secure credit as do their white counterparts.
How does gender affect overall household and credit card debt?
When it comes to debt management, the statistics show that women tend to borrow ever so slightly less than men.
Based on data from loan applicants, it was found that women on average borrowed $23,511, while the average figure for men stands at $24,095.
The table below shows how debt is distributed based on gender, taking into account both credit cards and student and personal loans:
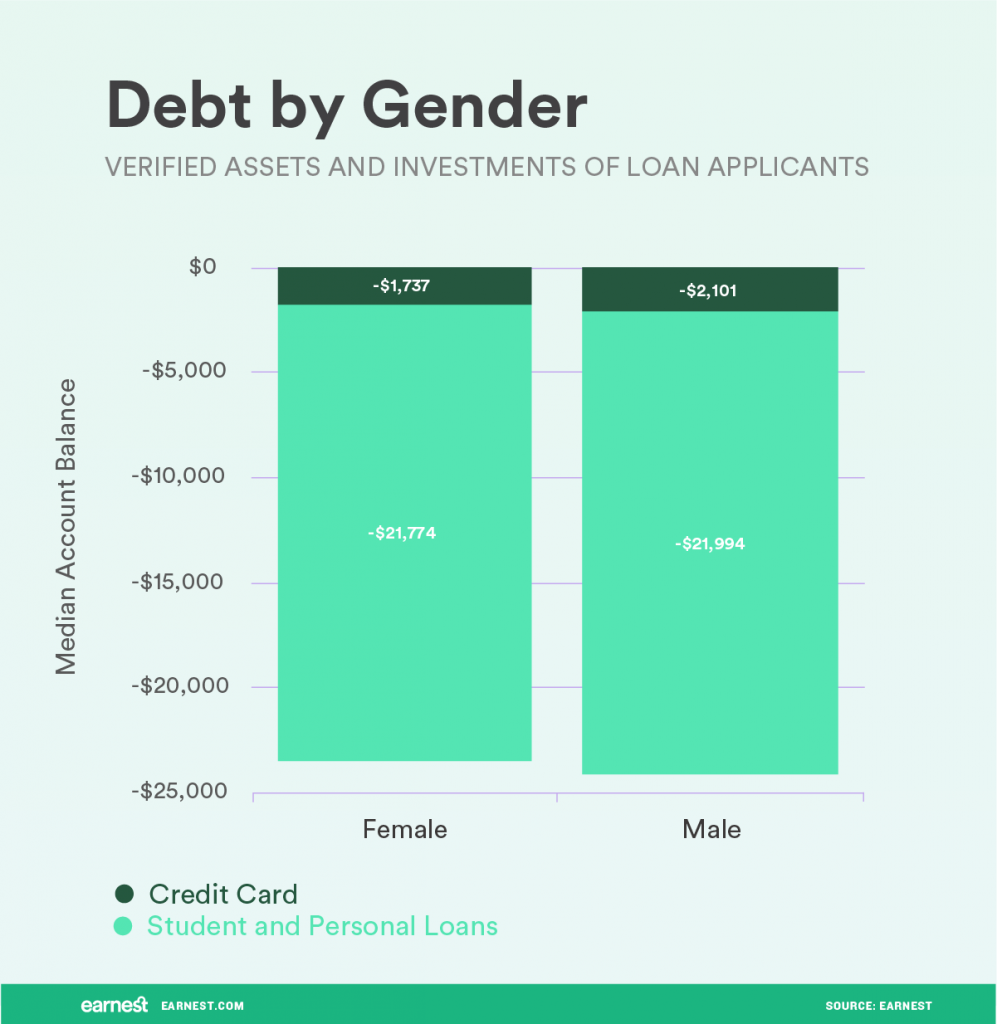
As you can see, the figures for both credit card borrowing and student and personal loans are slightly higher for men.
On average, men seem to be willing to borrow an extra 364 dollars on their credit cards, and an extra 220 dollars in personal loans.
How does the state you live in impact credit card debt?
The average household debt can vary greatly depending on the state that you live in.
The same thing is true for credit card debt.
For example, Alaska has the highest average credit card debt, totaling $13,048.
Ohio has the lowest average credit card debt, totaling much less than half of Alaska’s figure, ($5446).
If we look at the overall debt figures from the latest Federal Reserve report, we can see that the national average debt figure is just north of $50,000.

If you live in California, you are likely to owe much more debt overall than if you lived in any other state.
Let’s take a look at the total debt balance and how it is distributed throughout the U.S.
The following chart shows the total U.S. debt balance and the categories debt for every first quarter from 2003 to 2020
Credit card debt is in dark blue:

As you can see, all forms of debt have been on the rise since 2014, and credit card debt is the third-largest debt category after mortgages and student loans.
While each of the factors we have discussed has a significant impact on the amount of debt an individual is likely to accrue, none is quite as impactful in 2020 as the COVID 19 global pandemic.
Early signs that average debt will skyrocket as the pandemic forces Americans to borrow.
We’re now 3 months into the 2020 Lockdown, and many household incomes have plummeted.
Given the staggering number of businesses and families that are in trouble right now, household debt is understandably a huge concern for millions of Americans.
As more and more people turn to credit cards to get them through these rough financial times, U.S. credit card debt is on the rise.
According to a poll conducted in mid-April of 2020 (just after the lockdown was introduced) by Creditcards.com, 23% of U.S consumers had been forced to go deeper into debt as a direct result of the COVID 19 pandemic.
According to the Household Debt and Credit Report issued by the center for Micro Economic data, total household debt in the US increased by $155 billion in Q1 of 2020.
That’s an increase of 1.1% and it means that the total debt balance of U.S households in 2020 is now $14.30 Trillion.
As you can see in the chart below, overall credit card debt has actually fallen, far further than expected in the first quarter of 2020 (probably due to people having less disposable income during the pandemic).

However, the number of people borrowing on their credit cards to make ends meet is likely to continue to rise.
Indeed, credit card limits have also increased in the first quarter of 2020 by a total of $34 billion.
This means that there is now $3 trillion dollars of available credit that credit cardholders have not yet taken advantage of.
Given that we only have the official reports and figures up until March 31st, it is still too early to gauge the full financial impact of the COVID 19 pandemic on American households, but the Federal Reserve is monitoring the situation very closely.
In addition to credit card debt, the total U.S. debt in the form of Mortgages, student loans, and auto loans has also increased in Q1 of 2020.
Here are the amounts by which each has risen between Q4 of 2019 and Q1 of 2020:
- Mortgages – $156 billion increase.
- Student Loans – $27 billion increase.
- Auto Loans – $15 billion increase.
The average American household is unable to handle any extra financial strain.
The impact of the COVID 19 pandemic has wreaked havoc on an already struggling public.
A survey conducted in December of 2019 found that 45% of people had the not so princely sum of $0 in their bank account.
In fact, the same survey, conducted by GO Banking Rates, found that almost 70% of Americans had less than a thousand dollars saved up:

The survey also found that women had fewer savings than men, and their data also indicates that the group most vulnerable to extra financial strain caused by the global pandemic is those in the 45 to 54 age bracket:

With so many Americans living paycheck to paycheck, it’s now more important than ever to know what you can do to keep your debt levels as low as possible.
So let’s take a look at some tips for keeping debt under control.
What you can do to keep your debts manageable?
Rising debt in all areas during this difficult time can seem overwhelming, but there are a few things you can do to help keep on top of your finances.
I’d like to finish this post on a positive note.
So here is my best advice to help you to stay in control of your finances and keep your debts to a minimum.
Are you ready to hear the most simple but effective way you can stay ahead of debt?
Keep track of your finances and your spending.
It’s may sound like a really obvious piece of advice, but you’d be amazed at the number of people who don’t take the time and effort to figure out where they stand financially.
I can’t stress enough the importance of keeping track of your money.
You need to know exactly how much you have coming in and going out each month.
Get yourself a spreadsheet, or a budgeting app like You need a budget or Mint.
Go through your statements every month and group together your expenses into categories like rent, utilities, bills, Insurance, food, etc.
Then get rid of any unnecessary expenses, create a realistic budget, and stick to it.
Trust me, it will make a huge difference to your money managing habits.
Good luck!